Fluorescence Microscopy time-lapse analysis made easy
Image Analyst MKII is a microscopy image analysis
platform to visualize and measure biological parameters.
Typical workflows include graphing time-lapse image data
and high content analysis. Image Analyst MKII is ideal
for processing recordings with complexity ranging from
single frames to multi-dimensional data sets.
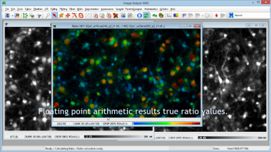
Interactive time lapse analysis for ion
concentrations and membrane potentials.
Automated microplate-based analysis for
cytometry and high content analysis.
Pipeline-based analysis of native image formats
without intermediate image data accumulated.
Image analysis cannot be simpler than using our interactive protocols.
Biologists new to microscopic image analysis can get to routine quickly by clicking each step and watching the application performing the analysis.
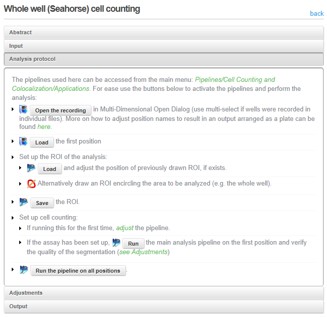
Ready-to-go interactive analysis protocols included for cell counting,
cytometry, histometry, intensity and ratio time courses and more ...
Image Analyst MKII supports a range of
fluorescence and bright field microscopic assays by generic
protocols for data recording on typical microscopy
systems and specific analysis protocols ranging from
cell counting to ion concentrations, potentials and
motility, using
pre-configured pipelines accessible from interactive
assay protocols or by menu selection. Analysis pipelines are applicable to wide field (epi-) fluorescence, confocal and two-photon microscopy.
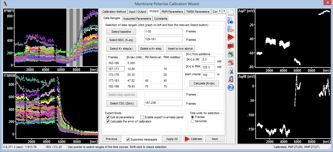
Turn fluorescence recordings of potentiometric probes straight into time courses of millivolt values. Image Analyst MKII provides the mitochondrial membrane potential measurement technology
developed by Akos Gerencser and colleagues (
17). This is supported by protocols for image acquisition, and an interactive protocol for image and data processing using the intuitive Membrane Potential Calibration Wizard dialog.
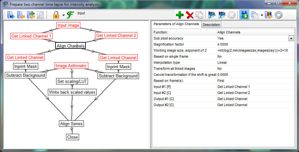
Over a hundred functions can be automated by simple, drag-and-drop,
flowchart based pipelines. 118 built-in,
menu-accessible pipelines support many basic and advanced image
processing tasks and a variety of biological applications. Routine pipeline
usage is greatly simplified by using pipeline parameters to control key
image processing functions within the pipeline. For basic use, the user
sees only these key parameters, but all built-in pipelines can be edited and arbitrarily modified.
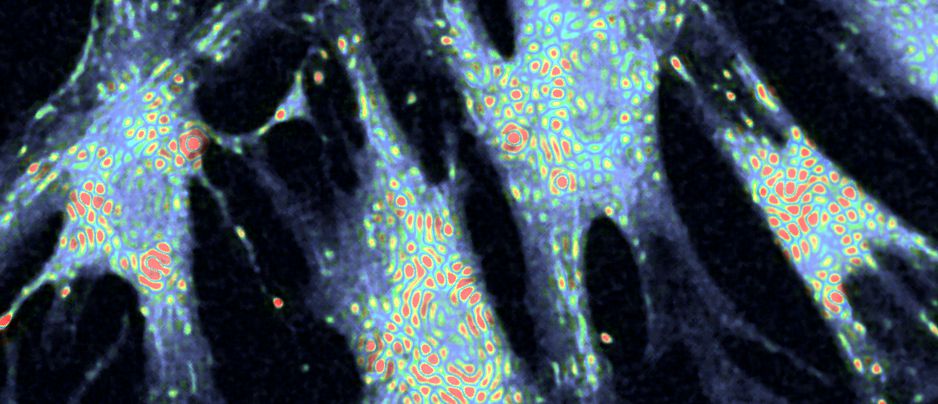
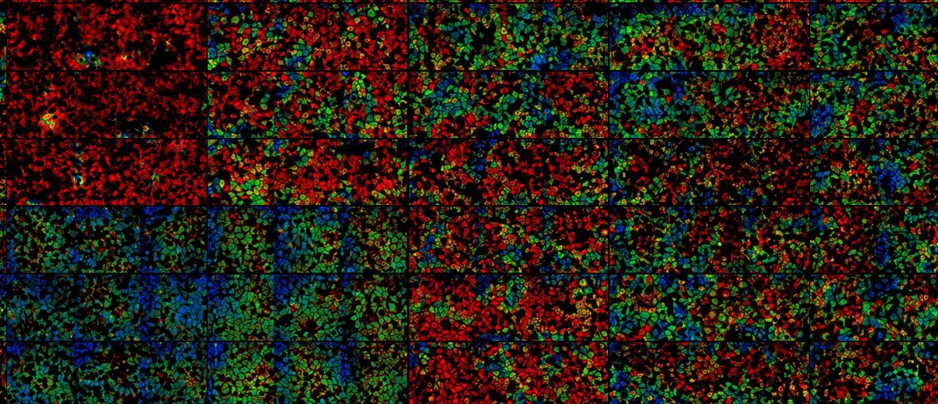
A Fully-Automated Senescence Test (FAST) for the high-throughput quantification of senescence-associated markers
Image Analyst MKII takes a center place in our new analysis method just published on
bioRxiv. We provide an automated workflow
for image and data analysis, from microplates to graphing.
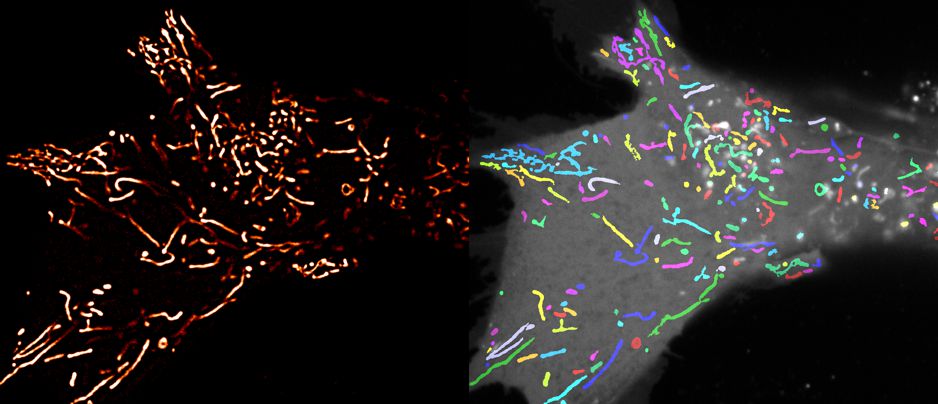
Integrating AI cell segmentation to find cells based on NADH autofluorescence
Site IQ in mitochondrial complex I generates S1QEL-sensitive superoxide/hydrogen peroxide in both the reverse and forward reactions. In Biochem J.
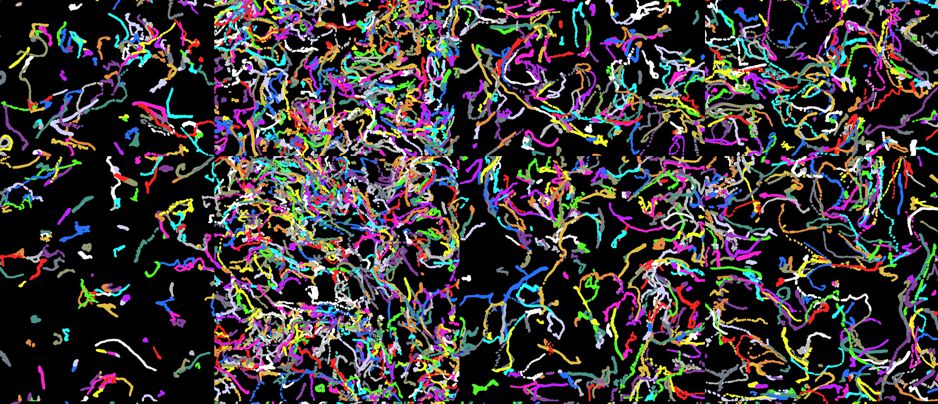
Automated ROI-based time lapse analysis using Cellpose
Pipeline integration for Elastix through command line execution
The complete protocol for ΔψM, ΔψP and mito:cell volume fraction assays have been published:
Unbiased Millivolts Assay of
Mitochondrial Membrane Potential in Intact Cells. In Methods in Molecular Biology