Pipeline Optimizer
The Pipeline Optimizer Dialog finds optimal values for one or multiple numeric parameters of a pipeline that achieve a user defined goal. Such goal can be finding the pipeline settings that produces the largest difference between positive and negative control recordings. The goal is defined by Excel formula computation within a template file. The output of the pipeline is collected into the template file. The template must calculate a single numeric value (such as a p-value or 1 - z-factor) from the output. This numeric value is minimized using the Differential Evolution algorithm.
- The input image recording must be loaded into a Multi-Dimensional Open dialog, and must have multiple positions. A statistically reasonable number of positions must be positive and negative controls.
- The pipeline is executed for all positive and negative control conditions, and this is repeated in an iterative manner while the software tests different parameter settings. For each iteration the Excel template is freshly reloaded, filled with analysis results and the statistical value, computed by the formula saved in the template, is retrieved.
- It is the user's task to lay out the Excel template in a way that a proper statistics is calculated from the positive and negative controls. The pipeline execution does not differentiate between positive and negative controls, but all requested positions are evaluated in order.
- The Pipeline Optimizer Dialog allows to set which parameters to optimize and in what range. The optimization is performed on discrete values, so besides the range, the number of steps looked at between a minimum and maximum values needs to be provided for each optimized parameter.
- At the end of the optimization, the optimum parameters can be saved as the default parameters for the optimized pipeline.
- How to find pipeline parameters that maximize the difference between positive and negative controls?
-
- Open a recording that has statistically reasonable number
of positions as positive and negative controls. File opening must result in
a
Multi-Dimensional Open dialog
 . If the data set is in multiple files, use multi selection, and
checkmark 'Merge as
Positions' in the
Multi-Dimensional Open dialog. See
here more on how to do
this.
. If the data set is in multiple files, use multi selection, and
checkmark 'Merge as
Positions' in the
Multi-Dimensional Open dialog. See
here more on how to do
this. - Activate the Pipeline to be optimized. Only pipelines with numerical parameters and with an output to the Excel Data Window can be optimized.
- Open the Excel Data Window (Tools/Excel Data Window).
- Process the data set.
- If the data set consists only the controls, use the Run Pipeline .. On All Stage Positions.
- If only a part of the data set are the controls, use Run Pipeline on Partial Plate. Provide a list of wells (positions) to be processed. Note down this list, as you will need to enter it in the Pipeline Optimizer Dialog.
- When processing is finished, In the Excel Data Window:
- Create a new worksheet and name it as 'Calculations'.
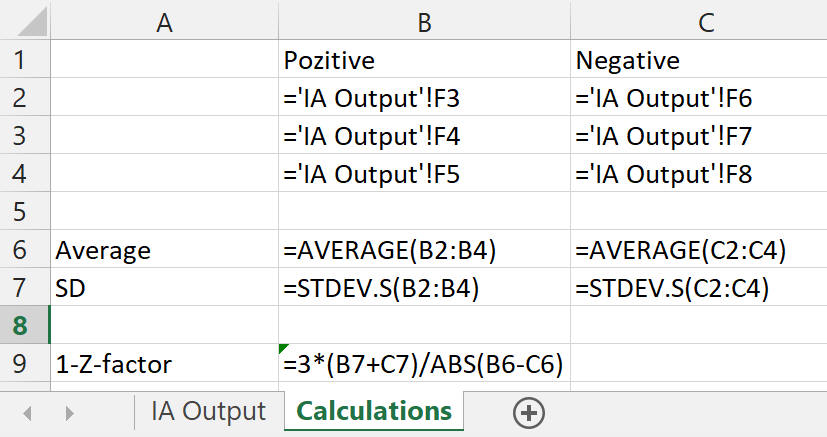
- In the Calculations worksheet create all statistical
calculations using formula computing and referencing to data in the
'IA Output' worksheet required to generate a single numerical value,
that approaches to zero when the goal is reached. This final result
of the calculation, that will be optimized must be a single
numerical value. Note down the cell reference to this calculated
value. Examples:
- To optimize z-factor, calculate averages and standard deviations of positive and negative control values using the 'Calculations' worksheet. In a cell then use 1 - the z-factor formula, as: =3*(sum of standard deviations)/ABS(difference of averages). Note down the cell reference, where this formula appears.
- To optimize a p-value, in the 'Calculations' worksheet
create two columns of values referencing the appropriate data in
the 'IA Output' worksheet. In a cell then use the TTEST function
to compare the two columns. Note down the cell reference, where
this formula appears. In the example below this is B9.
- Clear the 'IA Output' worksheet and save the workbook using the File/Save Excel Data as. This will be the template file.
- Open the Pipeline Optimizer Dialog (Tools/Pipeline Optimizer).
- Configuration of the Optimizer (go to the Optimizer Settings tab
and select Settings for Pipeline Optimizer):
- Set the 'Input image source' and 'Input positions list' according to how the data was analyzed above in the Multi-Dimensional Dialog. E.g. 'All positions' and the list line is left empty. Or 'List of positions' and the list line contains a comma separated list of positions or ranges given by dashes.
- In the 'Template Excel workbook' row locate the file you saved above.
- In the 'Worksheet of optimized cell' row provide the name of the Worksheet where the calculations can be found. This is 'Calculations' in the example above.
- In the 'Optimized' cell row provide the cell reference to the calculated value, such as A1.
- 'Penalty for erroneous run': Depending on the parametering, pipelines may fail or provide non-numeric output. The value of 'Penalty for erroneous run' will be used if no calculated numerical value is available or the pipeline fails.
- 'Pipeline processing timeout (sec)': It is also possible to provide a timeout in seconds if a pipeline hangs at a particular setting. The default 0 value disables this feature.
- Settings for Differential Evolution Core: these values need no adjustment, but allow the optimizer to be fine tuned.
- Pipeline Parameters tab:
- Optimize: checkmark parameters for optimization. Parameters marked with N/A are not numerical and are not available for optimization.
- For each check marked parameter, set a Minimum and Maximum value. The optimum will be sought within this, inclusive range. The optimization is performed on discrete values, So the number of steps looked at between a minimum and maximum values needs to be provided for each optimized parameter. Be conservative with the number of steps to shorten the run time. Typically 10-100.
- Save the Pipeline Optimizer settings before run (
 'Save configuration' button of the dialog)
 - Press the 'Optimize' button to start operation. Note: for more
complicated pipelines and larger numbers of parameters optimized
expect longer, e.g. overnight computation.
- After ~60 cycles (2x Population size in Settings/Differential Evolution Core) a part optimized, local optimum is available in the results pull-down, and this can be saved as default parameter.
- During optimization the 'Test' column shows the currently tested parameter values.
- The 'Optimum' column shows the best parameter set found so far.
- Configuration of the Optimizer (go to the Optimizer Settings tab
and select Settings for Pipeline Optimizer):
- Open a recording that has statistically reasonable number
of positions as positive and negative controls. File opening must result in
a
Multi-Dimensional Open dialog
- How to adjust a pipeline so its operation reflects manual results (e.g. object counts)?
-
- To optimize a pipeline (e.g. cell counting) in order to result in
similar values to manual evaluation of recording, follow the above
section with the following differences:
- No positive and negative controls are used. Technically one
image/position is sufficient here, but using more will make the results
more robust. Use the Multi-Dimensional Open dialog 'Clear and run
pipeline ... on Stage Position' button to evaluate positions one by one, so manual counting can be also performed.
Hint: use the crosshair ROI tool as ticker for the manual count.
- In the Calculations worksheet create the following
calculation using formula computing and referencing to data in the
'IA Output' worksheet:
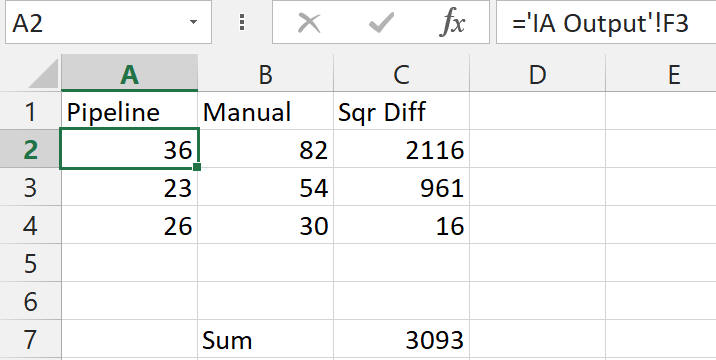
- Calculate the the square sum of differences of
pipeline-calculated counts and the manual counts in the
'Calculations' worksheet. Note down the cell reference, where
the square sum appears. In the example below this is C7.
- Calculate the the square sum of differences of
pipeline-calculated counts and the manual counts in the
'Calculations' worksheet. Note down the cell reference, where
the square sum appears. In the example below this is C7.
- No positive and negative controls are used. Technically one
image/position is sufficient here, but using more will make the results
more robust. Use the Multi-Dimensional Open dialog 'Clear and run
pipeline ... on Stage Position' button to evaluate positions one by one, so manual counting can be also performed.
Hint: use the crosshair ROI tool as ticker for the manual count.
- Proceed with the steps described in the previous section.
- To optimize a pipeline (e.g. cell counting) in order to result in
similar values to manual evaluation of recording, follow the above
section with the following differences: