Organize conditions, technical and experimental replicates in Graphpad Prism
Image Analyst MKII is an excellent tool for your research if you record multi-dimensional image sets with a microscope (see file format compatibility here), and you are looking for an efficient way for analyzing and organizing these data. You may be collecting data in multiple conditions using microplates, have technical and experimental (or biological) replicates in multiple recordings. Image Analyst MKII can collect analysis results from multiple data sets in a single Graphpad Prism file. In each experiment, technical replicates are pooled for each condition, and then the means of these pooled data are collected in a Summary Table for statistical analysis in Prism. Time courses are resampled at even intervals for row-by-row averaging. Graphs resulting from manual plotting, pipeline processing, including basic fluorescence intensity and ratio analysis interactive protocols, and the Membrane Potential Calibration Wizard can be organized in a Prism file. Alternatively, data collection in Excel is described here.
- No Graphpad Prism is required to save Prism files.
- Organize data based on position or condition names
- Pool technical replicates
- Collect experimental replicates from multiple recordings
- Time course averaging with resampling
- Append or update data in existing Prism files
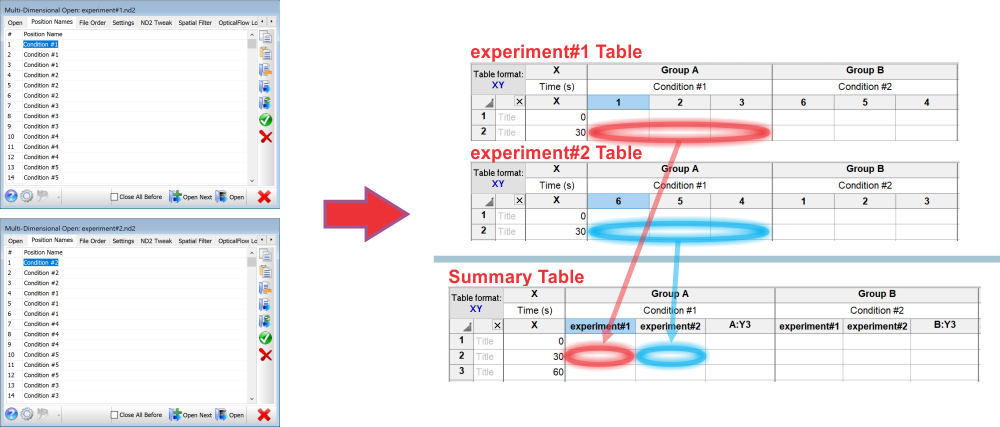
1. Open experiments and rename positions for condition names

2. Processed data is collected in a table for each experiment organizing conditions into columns with replicate positions. Each experiment is represented by the mean of replicates positions in the Summary Table.