By entering your email address and pressing the Subscribe button you agree to receive monthly - semimonthly newsletter from Image Analyst Software. Your email address will only be used for the distribution of the Image Analyst Newsletter, and will be never given to a third party. To unsubscribe, follow the link included at the bottom of the newsletter.
Privacy policy-
2016 March Assay Highlight: Mitochondrial Morphology & Dynamics
Image Analyst MKII is an innovative fluorescence microscopy image analysis
software dedicated to time-lapse and multi-position experiments in cell and
mitochondrial physiology. The March Newsletter highlights image processing tools
helping you to quantify mitochondrial morphology and dynamics in confocal and
wide field fluorescence microscopic recordings.
mitochondrial physiology | calcium imaging | membrane potential | reactive oxygen species | organelle and cell motility | shape changes in time
Image Analyst MKII combines the functionalities of a very efficient tool for routine image analysis and a tool for exploring novel approaches. It features time-lapse imaging or end point image analysis and automation of processing of multi-dimensional or microplate-based image recordings. Assay protocols are provided for generic microscopy systems along with analysis pipelines and protocols. Menu-accessible pipelines provide "biological decoding" of underlying image processing for easy access by biologists.
For more information visit our renewed website: www.imageanalyst.net.Feature highlight: Tools for mitochondrial morphology and dynamics
- Mitochondrial segmentation - menu-accessible pipelines have been optimized for segmentation of images of labeled mitochondria, including fluorescence over inhomogeneous background typical to wide-field microscopy.
- Follow how morphological parameters, numbers, length, width or roundness change in time. Do it with simple built-in pipelines.
- Quantify mitochondrial biogenesis with mitochondrion:cell volume fraction measurements using confocal microscopy.
- Follow mitochondrial swelling using the thinness ratio technique.
- Quantify mitochondrial motility with the optical flow technique.
See more information in our updated protocols page: www.imageanalyst.net/protocols.html
Image Analyst Software | 43 Nova Lane, Novato, CA, 94945, USA | (877)-874-0723 | sales@imageanalyst.net | www.imageanalyst.net
-
2016 February Assay Highlight: NAD(P)H Autofluorescence Analysis
Image Analyst MKII is an innovative fluorescence microscopy image analysis
software dedicated to time-lapse experiments primarily in the fields of cell and
mitochondrial physiology. The February Newsletter highlights an image processing tool that helps you
to resolve mitochondrial and cytosolic NAD(P)H autofluorescence.
mitochondrial physiology | calcium imaging | membrane potential | reactive oxygen species | organelle and cell motility | shape changes in time
Image Analyst MKII combines the functionalities of a very efficient tool for exploring time-lapse imaging data including automation of the analysis of multi-dimensional or microplate-based image recordings. Assay protocols are provided for generic microscopy systems along with analysis pipelines and protocols.
For more information visit our renewed website: www.imageanalyst.net.
Feature highlight: High pass spatial filtering distinguishes mitochondrially originated fluorescence
- High pass filtering transmits mitochondrial fluorescence (fluorescence originating from thin structures) and blocks cytosolic (bulk) fluorescence
- Optimization module allows automated search for the appropriate filter function
- Combination of high pass filtering with pharmacological calibration allows calculation of mitochondrial and cytosolic NADH/NAD+ ratios
Other related functions:
- low light level background subtraction
- image registration
- spectral unmixing
- automatic ROI drawing
- export of intensity traces to text or Excel files
Publication highlight
Just published in Cell Metabolism: Image Analyst MKII was used to extract mitochondrial NAD(P)H fluorescence from time lapses recorded by a Zeiss LSM 7MP two-photon microscope. High pass filtering allowed measurement of the redox states of mitochondrial and cytosolic pyridine nucleotide pools in human fibroblasts. (Wiley et al., Mitochondrial Dysfunction Induces Senescence with a Distinct Secretory Phenotype. Cell Metab. 2016 Feb 9;23(2):303-14 PMID: 26686024).
Image Analyst Software | 43 Nova Lane, Novato, CA, 94945, USA | (877)-874-0723 | sales@imageanalyst.net | www.imageanalyst.net
-
2015 December Assay Highlight:
Calcium Imaging
Image Analyst MKII is an innovative fluorescence microscopy image analysis
software dedicated to time-lapse experiments primarily in the fields of cell and
mitochondrial physiology. The December Newsletter highlights tools that help you
to analyze calcium imaging recordings.
calcium imaging | membrane potential | reactive oxygen species | organelle and cell motility | shape changes in time
Image Analyst MKII combines the functionalities of a very efficient tool for exploring time-lapse imaging data and automation of the analysis of multi-dimensional or microplate-based image recordings. Assay protocols are provided for generic microscopy systems along with analysis pipelines and protocols.
For more information visit www.imageanalyst.net.
Feature highlight: Analyze calcium imaging dataAnalyze image recordings with a single click: built-in pipelines perform:
- background subtraction
- image registration
- spectral unmixing
- automatic ROI drawing
- export of intensity or ratio traces to text or Excel files
Deal with special situations:- Use mean intensity projection of sub-stacks with Z-drift stabilization and X,Y-image registration to analyze two-photon or confocal microscopic Ca2+ imaging data.
- Follow intracellular Ca2+ in motile cells with tracking.
- Record large numbers of fluorescence traces by automatic image segmentation and automated, pipeline-based analysis of multi-stage position imaging data.
- Use high-pass filtering to measure fluorescence intensities originating
from small or thin objects, like mitochondria.
Publication highlightJust published in Nature: Signal integration by Ca2+ regulates intestinal stem-cell activity. (Deng, Gerencser and Jasper, Nature 2015 Epub Dec 2, PMID: 26633624). Image Analyst MKII was used for determination of GCaMP to mCherry fluorescence ratios in mean intensity projected XYZT-stacks recorded by a Zeiss LSM 7MP two-photon microscope. Image stabilization (registration) and mean intensity Z-projection in Image Analyst MKII enabled efficient use of ROIs to read out single cell fluorescence traces from tissue 3D recordings.
Image Analyst Software | 43 Nova Lane, Novato, CA, 94945, USA | (877)-874-0723 | sales@imageanalyst.net | www.imageanalyst.net
-
2015 November Assay Highlight: Reactive oxygen species measurements
Image Analyst MKII is an innovative fluorescence microscopy
image analysis software dedicated to time-lapse experiments primarily in the
fields of cell and mitochondrial physiology, including several one-of-a-kind assays
for mitochondrial shape changes, motility and membrane potential.
A version update for Image Analyst MKII (3.1.0) has been released in early
November, serving increased productivity in data analysis.
calcium imaging | membrane potential | reactive oxygen species | organelle and cell motility | shape changes in time
Image Analyst MKII combines the functionalities of a very efficient tool for exploring time-lapse imaging data and automation of the analysis of multi-dimensional or microplate-based image recordings. Assay protocols are provided for generic microscopy systems along with analysis pipelines and protocols.
For more information visit www.imageanalyst.net.
Assay highlight: Image analysis for reactive oxygen species measurements
- Background subtraction algorithms supporting low light level imaging
- Rate measurements - calculate and save rates of fluorescence increase over regions of interests - this is also a useful data reduction step when working with microplate image data
- Spectral unmixing
- Gating for debris and dead cells
- Image registration for gating readout to post-hoc immunocytochemistry
See our protocols for performing assays and image analysis for DCFDA, DHE and MitoSOX: help.imageanalyst.net/protocols.html
Image Analyst Software | 43 Nova Lane, Novato, CA, 94945, USA | (877)-874-0723 | sales@imageanalyst.net | www.imageanalyst.net
-
2015 October
Image Analyst MKII is an innovative fluorescence microscopy
image analysis software dedicated to time-lapse experiments primarily in the
fields of cell and mitochondrial physiology, including several one-of-a-kind assays
for mitochondrial shape changes, motility and membrane potential.
calcium imaging | membrane potential | reactive oxygen species | organelle and cell motility | shape changes in time
Image Analyst MKII combines the functionalities of a very efficient tool for exploring time-lapse imaging data and automation of the analysis of multi-dimensional or microplate-based image recordings. Assay protocols are provided for generic microscopy systems along with pipelines and analysis protocols.
For more information visit www.imageanalyst.net.
Assay highlight: Calculate mitochondrial membrane potential in millivolts in intact cells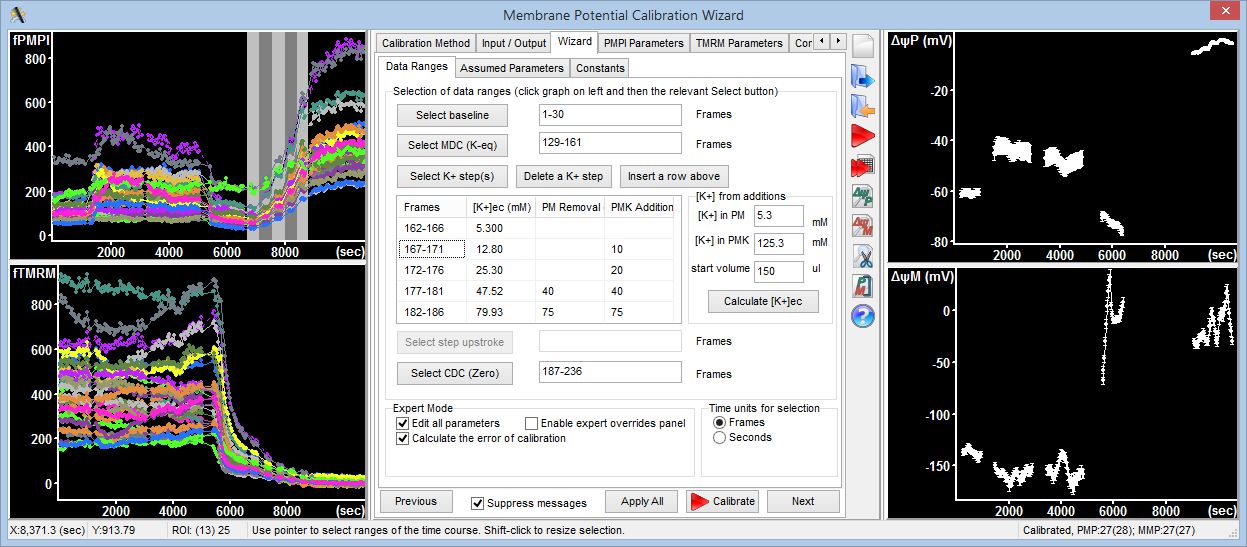
Image Analyst MKII provides the complete and extended version of the in situ plasma and mitochondrial membrane potential assay technique developed by Akos Gerencser and colleagues (PMID: 22495585). The assay is supported by protocols for data acquisition, pipelines for processing image data from a variety of microscopy formats and the intuitive Membrane Potential Calibration Wizard dialog designed for easy and routine use by biologists with no biophysical or mathematical expertise required.
Publication highlight

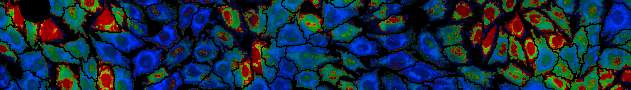
An application of the absolute mitochondrial membrane potential assay comparing healthy and diseased human samples has been published in the October issue of Endocrinology. The cover page of the journal shows a montage of artificially colored confocal micrographs and processed images used for the calculation of mitochondria:cell volume fractions using Image Analyst MKII.
Gerencser AA. Bioenergetic Analysis of Single Pancreatic β-Cells Indicates an Impaired Metabolic Signature in Type 2 Diabetic Subjects. Endocrinology. 2015;156(10):3496–503. PMID: 26204464
Image Analyst Software | 43 Nova Lane, Novato, CA, 94945, USA | (877)-874-0723 | sales@imageanalyst.net | www.imageanalyst.net